 Friday, October 23, 2026
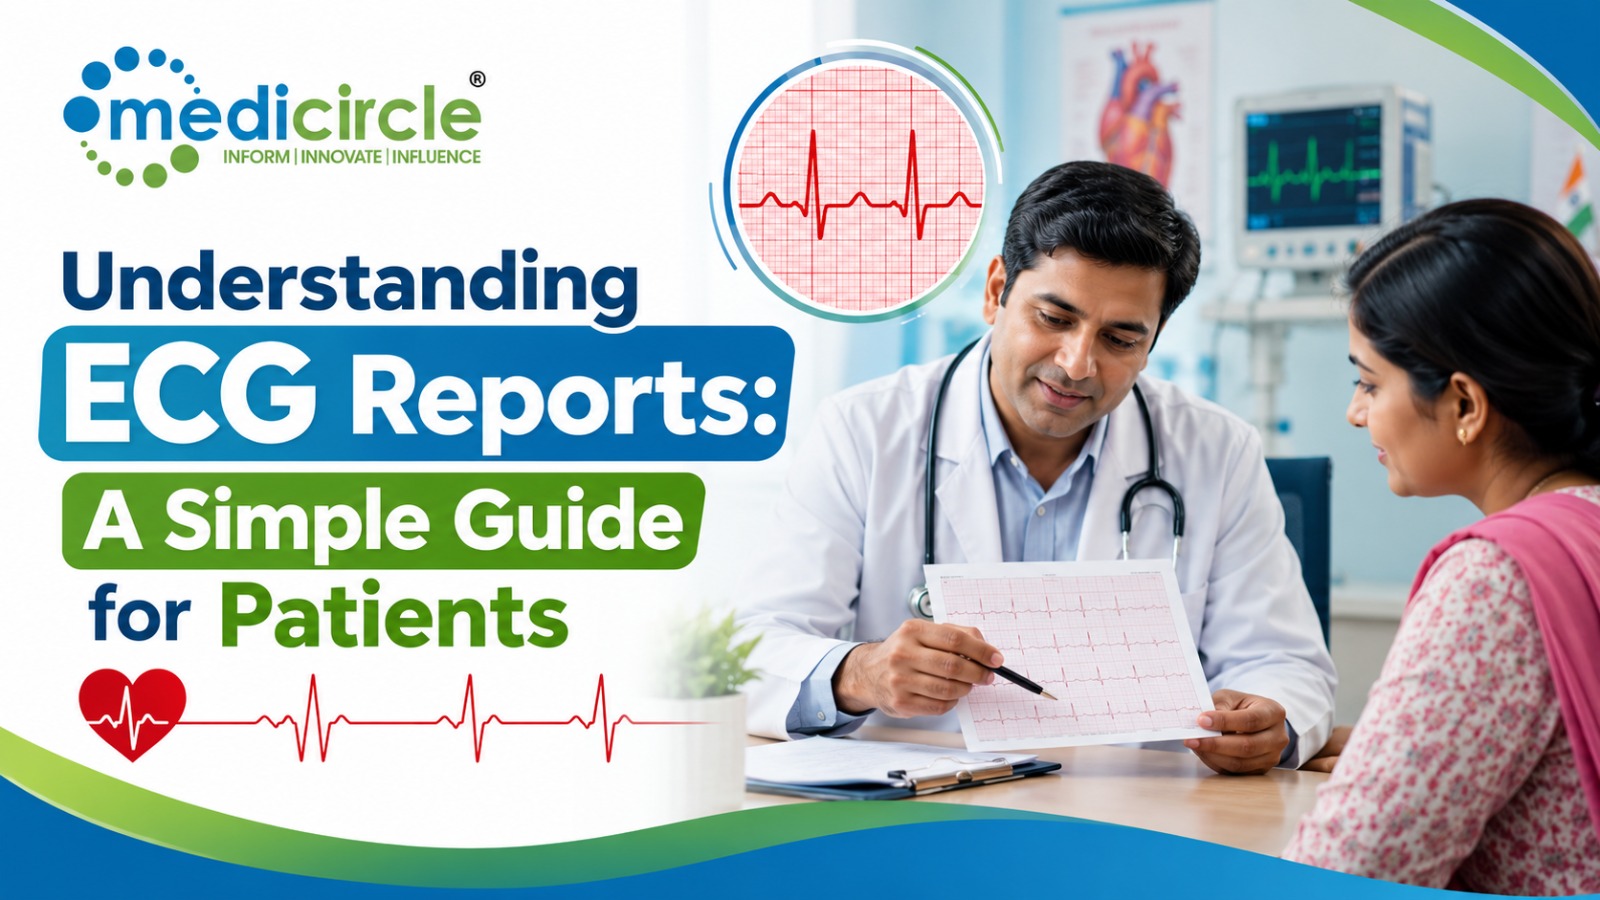
 This article explains how to read an ECG report in simple terms, covering waves, intervals, heart rate, rhythm, and when abnormal findings require urgent medical attention.





Introduction
An electrocardiogram, commonly known as an ECG or EKG, is one of the most widely used diagnostic tests in modern medicine. It is quick, painless, and inexpensive, yet the report it generates can look intimidating to anyone without a medical background. Rows of jagged lines, unfamiliar abbreviations, and numerical values often leave patients unsure of what they are looking at or what it means for their health.
This is precisely where confusion can create unnecessary anxiety. A patient handed an ECG printout after a routine health checkup, an insurance medical, or a visit to the emergency department deserves to understand, at least in basic terms, what the report is telling them. Doctors will always provide the final clinical interpretation, but knowing the fundamentals of an ECG report helps patients ask better questions, follow up more effectively, and feel more confident during consultations.
In India, where cardiovascular disease has become one of the leading causes of death and where screening is increasingly recommended even for younger adults, ECG literacy among the general public has real value. This article breaks down what an ECG measures, how to read the basic components of a report, what common findings mean, and when a result genuinely warrants medical attention.
What Is an ECG and Why Is It Done
An ECG records the electrical signals generated by the heart as it contracts and relaxes with each beat. Electrodes placed on the chest, arms, and legs pick up these signals and translate them into a graphic tracing. This tracing reflects the heart's rate, its rhythm, and the pathway that its electrical impulses take through different chambers.
Doctors order ECGs for a wide range of reasons. Some patients undergo the test as part of a routine annual health checkup, particularly after the age of 40. Others are referred for an ECG because they report chest discomfort, palpitations, breathlessness, unexplained fatigue, or dizziness. The test is also a standard requirement before certain surgeries, during pregnancy in specific cases, and as part of pre-employment or insurance medical examinations.
The value of an ECG lies in its ability to detect problems that may not be visible through a physical examination alone. Irregular heart rhythms, evidence of a past or ongoing heart attack, structural heart changes, and electrolyte disturbances can all leave a signature on an ECG tracing. Given the rising burden of ischaemic heart disease across Indian cities, particularly in Tier 1 metros with high-stress lifestyles and Tier 2 cities where dietary patterns are shifting toward processed foods, the ECG remains a frontline screening tool recommended by cardiologists and general physicians alike.
Understanding the Basic Components of an ECG Report
Every ECG tracing is built from a repeating pattern of waves, each representing a distinct electrical event in the cardiac cycle. Understanding these components in simple terms makes the rest of the report far less confusing.
The P wave is the first small upward movement seen on the tracing. It represents the electrical activity of the atria, the heart's upper chambers, as they contract to push blood into the ventricles. A P wave that appears normal in shape and duration, followed consistently by a QRS complex, is generally a reassuring sign of what doctors call sinus rhythm.
The QRS complex follows the P wave and is usually the tallest, most prominent part of the tracing. It represents the electrical activity of the ventricles, the heart's main pumping chambers, as they contract. Because the ventricles generate a much larger muscle mass movement than the atria, this complex appears as a sharp spike on the ECG.
The T wave comes after the QRS complex and reflects the recovery phase of the ventricles, known as repolarisation, as the heart resets itself for the next beat. Between these waves lie intervals and segments, such as the PR interval and the QT interval, which measure the time taken for electrical signals to travel between different parts of the heart. Abnormal lengthening or shortening of these intervals can point toward conduction problems or electrolyte imbalances.
Reading the Rate, Rhythm, and Common Report Terms
Two of the first things a doctor checks on any ECG are the heart rate and the rhythm, and patients often see these terms mentioned directly in their reports.
A normal resting heart rate for adults typically falls between 60 and 100 beats per minute. A rate below 60 is termed bradycardia, while a rate above 100 is called tachycardia. Neither term automatically indicates disease. Well-trained athletes commonly have resting heart rates in the 50s due to a stronger, more efficient heart, while fever, anxiety, dehydration, or physical exertion can temporarily push the rate above 100 in an otherwise healthy person.
Rhythm refers to the regularity of the heartbeat. A report stating "normal sinus rhythm" means the heartbeat originates correctly from the sinoatrial node and follows an orderly pattern. When the rhythm is irregular, the report may mention terms such as atrial fibrillation, in which the P waves are absent, and the rhythm becomes chaotic, or heart block, in which the electrical signal is delayed or interrupted somewhere between the atria and ventricles.
A few bullet points can help clarify some of the most commonly seen terms on Indian ECG reports:
- PR interval: the time taken for the electrical impulse to travel from the atria to the ventricles. A prolonged PR interval may suggest a conduction delay known as first-degree heart block.
- QT interval: reflects the total time for ventricular activation and recovery. A prolonged QT interval can be linked to certain medications or electrolyte disturbances and requires medical evaluation.
- ST segment changes: elevation or depression of this segment often prompts urgent evaluation, as it can indicate reduced blood flow to the heart muscle.
Patients should remember that isolated technical terms on a report do not equal a diagnosis. Context, symptoms, and the treating doctor's clinical judgement always guide the final interpretation.
When an ECG Finding Needs Further Medical Evaluation
Certain findings on an ECG report call for prompt medical attention rather than a wait-and-watch approach. ST segment elevation, particularly when accompanied by chest pain, is a classic warning sign of an acute heart attack and is treated as a medical emergency in hospitals across India. Similarly, significant ST depression can point toward reduced blood supply to the heart muscle, a condition known as ischaemia.
The complete absence of P waves combined with an irregular rhythm often indicates atrial fibrillation, a condition that raises the risk of stroke if left unmanaged and typically requires blood-thinning medication along with rhythm control. A widened QRS complex may suggest a bundle branch block, where the heart's electrical impulse takes a slower, less efficient route through the ventricles. While this can be a benign, long-standing finding in some patients, in others it may signal underlying heart disease that needs further imaging, such as an echocardiogram.
It is worth noting that an ECG is a snapshot in time. A patient experiencing intermittent symptoms such as occasional palpitations may have a completely normal ECG between episodes. In such cases, doctors in India increasingly recommend extended monitoring options such as a Holter monitor, which records heart activity over 24 to 48 hours, to capture the abnormal rhythm when it actually occurs.
The Growing Role of ECG Screening in India
Cardiovascular disease has emerged as a major public health concern across the country, contributing to a substantial share of all deaths nationally, with the burden falling disproportionately on relatively younger populations compared to Western nations. This trend has been linked to rising rates of diabetes, hypertension, tobacco use, sedentary lifestyles, and dietary shifts toward high-salt, high-fat processed foods common in urban India.
In response, government health initiatives under the National Programme for Prevention and Control of Non-Communicable Diseases have encouraged wider screening at primary health centres, and digital health efforts under the Ayushman Bharat Digital Mission are gradually making it easier for ECG records to be stored and shared across healthcare providers. Portable and low-cost ECG devices are also being piloted at primary health centres in states such as Gujarat and Rajasthan, extending basic cardiac screening to rural and semi-urban populations who previously had limited access to diagnostic cardiology services.
For hospitals, diagnostic chains, and healthtech innovators working in this space, credible patient education around tests like the ECG plays a meaningful role in improving screening uptake and reducing delays in seeking care after an abnormal result. Platforms that responsibly translate clinical findings into accessible language, connecting the expertise of cardiologists with the everyday concerns of patients, support this larger public health goal of catching heart disease earlier rather than later.
Preparing for an ECG and Making Sense of Your Report
Very little preparation is required before an ECG. Patients are generally asked to avoid heavy meals, caffeine, and strenuous exercise for a short period beforehand, as these can temporarily affect heart rate. Wearing loose, easily removable clothing helps the technician attach the electrodes to the chest, arms, and legs without difficulty.
Once the report is generated, most machines also print an automated interpretation alongside the raw tracing. Patients should treat this automated reading as a preliminary suggestion rather than a final verdict. Automated software can misread artefacts, patient movement, or lead placement errors as abnormalities. The definitive interpretation should always come from a qualified doctor who considers the tracing alongside the patient's symptoms, medical history, and, where needed, additional tests.
Patients are encouraged to keep copies of previous ECG reports, particularly if they have a known heart condition or are on long-term cardiac medication. Comparing a current ECG with an older one often helps doctors distinguish a genuinely new problem from a longstanding, stable finding.
Conclusion
An ECG report may look like a wall of unfamiliar lines and abbreviations at first glance, but its underlying logic is fairly straightforward once broken down into its core components: the P wave, the QRS complex, the T wave, and the intervals between them. Understanding these basics does not replace the expertise of a cardiologist or physician, but it does empower patients to engage more meaningfully with their own health, ask informed questions, and respond appropriately when a report flags something that needs attention.
As cardiovascular disease continues to affect Indians at increasingly younger ages, tools like the ECG will remain central to early detection and timely treatment. Pairing this simple, accessible test with growing health literacy among patients across India's cities and towns is one practical step toward better heart health outcomes nationwide.
Frequently Asked Questions
Q1: What does an ECG report actually show?
An ECG report shows the electrical activity of the heart recorded as a series of waves, namely the P wave, QRS complex, and T wave, along with measured intervals such as the PR interval, QRS duration, and QT interval. These values help doctors assess heart rate, rhythm, and the general health of the heart's electrical conduction system.
Q2: Can a normal ECG rule out a heart attack?
Not entirely. A normal ECG at a single point in time reduces the likelihood of an active heart attack but does not completely rule it out, especially in early stages. Doctors often combine ECG findings with blood tests such as troponin levels and clinical symptoms to reach a diagnosis.
Q3: Why does my ECG report mention sinus rhythm?
Sinus rhythm simply means the heartbeat is originating from the sinoatrial node, which is the heart's natural pacemaker, and following a normal electrical pathway. Normal sinus rhythm is a reassuring finding and indicates the heart's electrical system is functioning as expected.
Q4: Is an ECG the same as an echocardiogram?
No. An ECG records the electrical activity of the heart using electrodes placed on the skin, while an echocardiogram uses ultrasound waves to create moving images of the heart's structure and pumping function. The two tests provide different but complementary information.
Q5: How much does an ECG test cost in India?
The cost of a standard 12-lead ECG in India typically ranges between 150 and 800 rupees in most diagnostic centres and hospitals, though this can vary based on the city, the facility, and whether the test is bundled with a cardiologist consultation.
Resources
- World Health Organization: Global reports and guidance on cardiovascular disease prevention and control
- Indian Council of Medical Research (ICMR): Guidelines and research publications on non-communicable diseases in India
- Ministry of Health and Family Welfare, Government of India: National Programme for Prevention and Control of Non-Communicable Diseases resources
- Ayushman Bharat Digital Mission: Information on digital health records and diagnostic data integration
- National Medical Commission (NMC): Standards and guidelines for diagnostic and clinical practice in India
Interlinking Keywords
ECG test, heart rhythm disorders, cardiologist consultation, echocardiogram, heart attack symptoms, cardiovascular disease in India, Holter monitor, heart health checkup
Last medically reviewed by:
Medicircle Medical Advisory Panel on July 18, 2026
Medical Disclaimer:
This article is intended for general informational and educational purposes only and does not constitute medical advice, diagnosis, or treatment. The content should not be used as a substitute for professional medical consultation. Readers experiencing symptoms or concerns related to heart health should consult a qualified cardiologist or physician for accurate diagnosis and personalised treatment. Medicircle and the author do not assume responsibility for any actions taken based on the information provided in this article.





-23-300x250.png)

.jpeg)
.jpg)
.jpg)
.jpg)
.jpg)
.jpg)
.jpg)
.jpg)
.jpg)
.jpg)